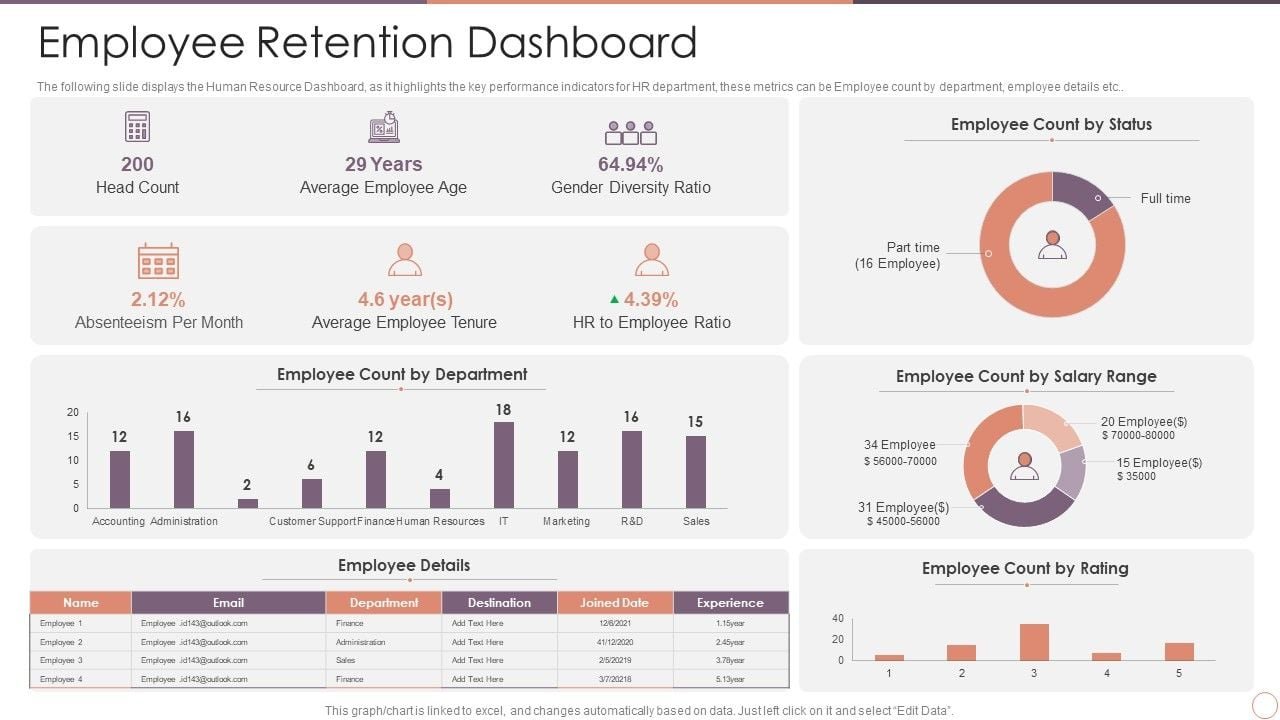
Employee Turnover Dashboard in Google Sheets
Creating an Employee Turnover Dashboard in Google Sheets is a valuable tool for businesses to track, analyze, and respond to employee turnover effectively.

Employee turnover, the rate at which employees leave a company and need to be replaced, is a critical metric for businesses to monitor. High turnover can lead to increased costs, decreased productivity, and lowered morale within the organization. To effectively track and analyze employee turnover data, businesses can create an Employee Turnover Dashboard using Google Sheets, a versatile and accessible tool for data visualization and analysis.
1. Setting up Data Collection
The first step in creating an Employee Turnover Dashboard in Google Sheets is to gather and organize relevant data. This data may include information such as employee names, hire dates, termination dates (if applicable), reasons for leaving, and any other pertinent details. This data can be collected manually or imported from existing HR systems or databases.
2. Organizing Data in Google Sheets
Once the data is collected, it should be organized in Google Sheets in a clear and structured format. Each column should represent a different data point, with rows corresponding to individual employees. Additionally, it can be helpful to create separate sheets within the Google Sheets document to organize different types of data (e.g., employee information, turnover reasons, trends over time).
3. Calculating Turnover Metrics
Next, calculate various turnover metrics using formulas in Google Sheets. Common turnover metrics include:
- Turnover Rate: The percentage of employees who have left the company within a certain time period.
- Voluntary Turnover Rate: The percentage of employees who have left the company voluntarily (e.g., resignations).
- Involuntary Turnover Rate: The percentage of employees who have been terminated or laid off by the company.
- Average Tenure: The average length of time employees have been with the company before leaving.
These metrics can provide valuable insights into the reasons for turnover and help identify areas for improvement.
4. Visualizing Data with Charts and Graphs
Google Sheets offers various tools for visualizing data, including charts and graphs. Use these tools to create visual representations of turnover metrics, such as:
- Line Charts: Show trends in turnover rates over time.
- Pie Charts: Illustrate the proportion of voluntary vs. involuntary turnover.
- Bar Charts: Compare turnover rates between different departments or job roles.
Visualizing data in this way makes it easier to identify patterns and trends at a glance.
5. Adding Filters and Interactivity
To make the Turnover and Retention Dashboard more user-friendly and interactive, consider adding filters and dropdown menus that allow users to customize the view. For example, users
may want to filter the data by department, location, or time period to focus on specific segments of the workforce or analyze trends more closely.
6. Sharing and Collaboration
Once the Employee Turnover Dashboard is complete, share it with relevant stakeholders within the organization, such as HR managers, department heads, and senior leadership. Google Sheets allows for easy sharing and collaboration, enabling multiple users to view and edit the dashboard in real-time. Encourage collaboration and discussion around the data to drive informed decision-making and action planning.
7. Continuously Monitoring and Updating
Finally, employee turnover is an ongoing process, so it's essential to continuously monitor and update the Employee Turnover Dashboard to reflect the latest data. Regularly review turnover metrics, identify any significant changes or trends, and adjust strategies accordingly to minimize turnover and retain top talent within the organization.
Conclusion
In conclusion, creating an Employee Turnover Dashboard in Google Sheets is a valuable tool for businesses to track, analyze, and respond to employee turnover effectively. By organizing and visualizing turnover data in a clear and accessible format, businesses can gain insights into the reasons for turnover, identify areas for improvement, and implement strategies to enhance employee retention and overall organizational success.


